
Topics Covered In This Chapter:
- 3 Different Types of Errors
- IDLE's Debugger
- Stepping Into, Over, and Out
- Go and Quit
- Break Points
Bugs!
"On two occasions I have been asked, 'Pray, Mr. Babbage, if you put into the machine wrong figures, will the right answers come out?' I am not able rightly to apprehend the kind of confusion of ideas that could provoke such a question."
-Charles Babbage, 19th century English mathematician, philosopher, inventor and mechanical engineer who originated the concept of a programmable computer.http://en.wikipedia.org/wiki/Charles_Babbage
-Charles Babbage, 19th century English mathematician, philosopher, inventor and mechanical engineer who originated the concept of a programmable computer.http://en.wikipedia.org/wiki/Charles_Babbage
If you enter the wrong code, the computer will not give you the right program. A computer program will always do what you tell it to, but what you tell the program to do might not be the same as what you wanted the program to do. A bug is another name for an error or problem in a computer program. Bugs happen when the programmer has not carefully thought about what exactly the program is doing. There are three types of bugs that can happen with your program:
- Syntax Errors are a type of bug that comes from typos in your program. When the Python interpreter sees a syntax error, it is because your code is not written in proper Python language. A Python program with even a single syntax error will not run.
- Runtime Errors are bugs that happen while the program is running (that is, executing). The program will work up until it reaches the line of code with the error, and then the program terminates with an error message (this is called crashing). The Python interpreter will display something called a "traceback" and show the line where the problem happens.
- Semantic Errors are the trickiest bugs to fix. This bug does not crash the program, and the program may appear to work fine. However, it is not doing what the programmer intended for the program to do. For example, if the programmer wants the variable total to be the sum of the values in variables a, b, and c but writes total = a + b * c, then the value in total will be wrong. This won't cause the program to crash immediately, but may or may not cause some other code to crash later on because of the unexpected value in total.
Finding bugs in our program can be hard, if you even notice them at all! When running your program, you may discover that sometimes functions are not called when they are suppose to be, or maybe they are called too many times. You may code the condition for a while loop wrong, so that it loops the wrong number of times. (A loop in your program that never exits is a kind of bug is called an infinite loop. In order to stop this program, you can press Ctrl-C in the interactive shell.) Any of these things could mistakenly happen in your code if you are not careful.
It can be hard to figure out how your code could be producing a bug because all the lines of code get executed very quickly and the values in variables change so often. A debugger is a program that lets you step through your code one line at a time (in the same order that Python executes them), and shows what values are stored in all of the variables. A debugger lets you look at how each line of code affects your program. This can be very helpful to figure out what exactly the program is doing.
A video tutorial on using the debugger that comes with IDLE can be found on this book's website at http://inventwithpython.com/videos/
Starting the Debugger
In IDLE, go ahead and open the Dragon Realm game that you made in the last chapter. In the interactive shell, click on File and then Open, and then select dragon.py (or whatever you named the file when you saved it).
After opening the dragon.py file, click on the Debug menu item at the top of the interactive shell, and then click Debugger to make the Debug Control window appear (Figure 7-1).
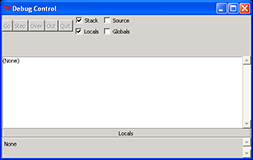
Figure 7-1: The Debug Control window.
Now when you run the Dragon Realm game (by pressing F5 or clicking Run, then Run Module in the file editor window's top menu), the debugger program will be activated. This is called running a program "under a debugger". In the Debug Control window, check the Source and Globals checkboxes. Then run the program by pressing F5 in the file editor window (Figure 7-2).
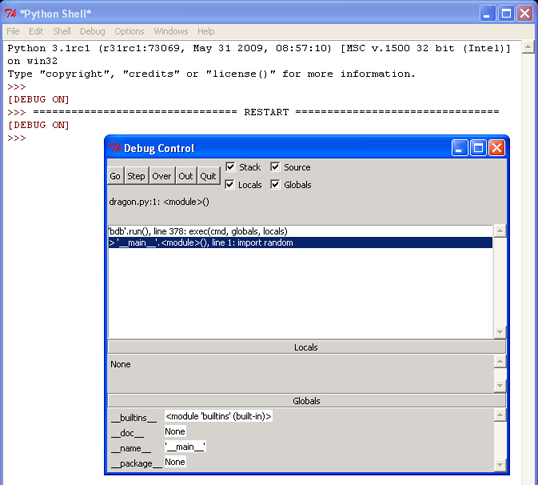
Figure 7-2: Running the Dragon Realm game under the debugger.
When you run Python programs with the debugger activated, the program will stop before it executes the first line of code. If you click on the file editor window's title bar (and you have checked the Source checkbox in the Debug Control window), the first line of code is highlighted in gray. Also, the Debug Control window shows that you are on line 1, which is the import random line.
The debugger lets you execute one line or code at a time (called "stepping"). To execute a single instruction, click the Step button in the Debug Window. Go ahead and click the Step button once. This will cause the Python interpreter to execute the import random instruction, and then stop before it executes the next instruction. The Debug Control window will change to show that you are now on line 2, the import time line.
Stepping
Here is a summary of what happens when you click the Step button when you run the Dragon Realm game under a debugger. A detailed description is below it.
- Click the Step button twice to run the two import lines.
- Click the Step button three more times to execute the three def statements.
- Click the Step button again to define the playAgain variable.
- Click Go to run the rest of the program, or click Quit to terminate the program.
Stepping is the process of executing one instruction of the program at a time. Doing this lets you see what happens after running a single line of code, which can help you figure out where a bug first appears in your programs.
The Debug Control window will show you what line is about to be executed when you click the Step button in the Debug Control window. This window will also tell you what line number it is on and show you the line of code itself. Remember to have the
Click the Step button twice to run the two import lines.
Click the Step button again to run the import time instruction. The debugger will execute this import statment and then move to line 4. The debugger skipped line 3 because it is a blank line. Notice that you can only step forward with the debugger, you cannot go backwards.
Click the Step button three more times to execute the three def statements.
Click the Step button three more times. This will execute the three def statements to define these functions. As you define these functions, they will appear in the Globals area of the Debug Control window.
The text next to the function names in the Global area will look something like "<function checkCave at 0x012859B0>". The module names also have confusing looking text next to them, such as "<module 'random' from 'C:\\Python31\\lib\\random.pyc'>". This is detailed information is useful to advanced Python programmers, but you don't need to know what it means to debug your programs. Just seeing that the functions and modules are there in the Global area will tell you if the function has been defined or the module has been imported. You can also ignore the __builtins__, __doc__, and __name__ lines in the Global area. (Those are variables that appear in every Python program.)
Click the Step button again to define the playAgain variable.
The debugger will now be (after clicking Step four times) at line 35, the playAgain = 'yes' line. When you click Step to execute this line, the playAgain variable will be created and will show up in the Global area. Next to it will be the value stored in this variable, which is the string 'yes'. The debugger lets you see the values of all the variables in the program as the run program runs. This can be very useful if you need to fix your programs.
The Global area in the Debug Control window is where all the global variables are stored. Remember, global variables are the variables that are created outside of any functions (that is, in the global scope). There is also a Local area, which shows you the local scope variables and their values. The local area will only have variables in it when the program execution is inside of a function. Since we are still in the global scope, this area is blank.
The Python debugger (and almost all debuggers) only lets you step forward in your program. Once you have executed an instruction, you cannot step backwards and undo the instruction.
The Go and Quit Buttons
If you get tired of clicking the step button over and over again, and just want the program to run normally, click the Go button at the top of the Debug Control window. This will tell the program to run as if you didn't have the debugger turned on.
If you ever want to terminate the program while it is running, just click the Quit button at the top of the Debug Control window. The program will immediately exit. This can be handy if you want to stop the program and start debugging it from the beginning again.
Stepping Into, Over, and Out
Start the Dragon Realm program with the debugger, and keep stepping (by clicking the Step button in the Debug Control window) until the debugger is at line 38 (the call to displayIntro() line). When you click Step again, the debugger will jump into this function call and appear on line 5 (the first line in the def-block of the displayIntro() function. The kind of stepping we have been doing is called stepping into, because it will step into function calls.
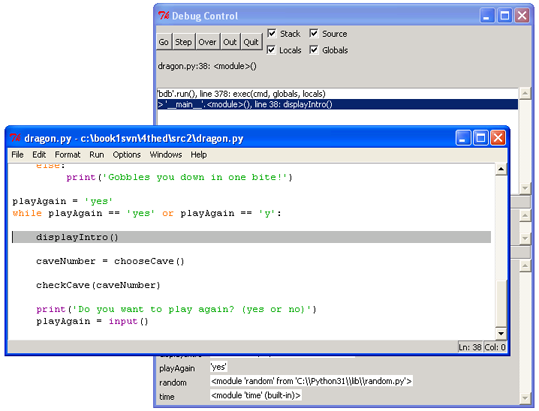
Figure 7-3: Keep stepping until you reach line 38.
If you click Step a few more times, you will see the output of the print() function call appear in the interactive shell window one at a time. When you step over the last print() function call in thedisplayIntro() function, the debugger will jump back to the first line (line 40) after function call.
Click Step one more time to step into the chooseCave() function. Keep stepping through the code until you execute the function call input() call. The program will wait until you type a response into the shell, just like when you run the program normally. If you try clicking the Step button now, nothing will happen because the program is waiting for a keyboard response.
Enter a response by clicking back on the interactive shell window and type which cave you want to enter. You have to click on the bottom line in the shell before typing. If you are typing but nothing appears on the screen (and the blinking cursor is not below the Which cave will you go into? (1 or 2) text), then you have not clicked on the last line of the shell window.
Once you press the Enter key to enter your response, the debugger will continue to step lines of code again. Instead of clicking Step, try clicking the Out button on the Debug Control window. This is called stepping out, because it will cause the debugger to step over as many lines as it needs to until it jumps out of the function that it was in. After it jumps out, the execution will be on the line after the line that called the function. For example, if you were inside the displayIntro() function on line 6, clicking Out would have the debugger keep stepping until the function was over and returned to the line after the call to displayIntro(). Stepping out can save you from having to click Step over and over again to jump out of the function.
If you are not inside a function (that is, you are in the global scope) and you click Out, the debugger will execute all the remaining lines in the program (exactly as if you clicked the Go button).
The last kind of stepping is done by the Over button in the Debug Control window, and it is for stepping over function calls. Stepping over means that the debugger will not step into function calls. Instead, the debugger executes all the code inside the function at once and only stop at the line after the function call. This is useful if you do not want to step through every single line inside the function. (Think of Stepping Over as the same as Stepping Into and then immediately Stepping Out.)
You now know what the five buttons at the top of the Debug Control window do. Here's a recap of what each button does:
- Go - Executes the rest of the code as normal, or until it reaches a break point. (Break points are described later.)
- Step - Step one line of code. If the line is a function call, the debugger will step into the function.
- Over - Step one line of code. If the line is a function call, the debugger will not step into the function, but instead step over the call.
- Out - Keeps stepping over lines of code until the debugger leaves the function it was in when Out was clicked. This steps out of the function.
- Quit - Immediately terminates the program.
Find the Bug
Using the debugger is a good way to figure out what is causing bugs in your program. As an example, here is a small program that has a bug in it. The program comes up with a random addition problem for the user to solve. In the interactive shell window, click on File, then New Window to open a new file editor window. Type this program into that window, and save the program as buggy.py.
buggy.py
- import random
- number1 = random.randint(1, 10)
- number2 = random.randint(1, 10)
- print('What is ' + str(number1) + ' + ' + str(number2) + '?')
- answer = input()
- if answer == number1 + number2:
- print('Correct!')
- else:
- print('Nope! The answer is ' + str(number1 + number2))
Type the program in exactly as it is above, even if you can already tell what the bug is. Then trying running the program by pressing F5. This is a simple arithmetic game that comes up with two random numbers and asks you to add them. Here's what it might look like when you run the program:
What is 5 + 1?
6
Nope! The answer is 6
6
Nope! The answer is 6
That's not right! This program has a semantic bug in it. Even if the user types in the correct answer, the program says they are wrong.
You could look at the code and think hard about where it went wrong. That works sometimes. But you might figure out the cause of the bug quicker if you run the program under the debugger. At the top of the interactive shell window, click on Debug, then Debugger (if there is no check already by the Debugger menu item) to display the Debug Control window. In the Debug Control window, make sure the all four checkboxes (Stack, Source, Locals, and Globals) are checked. This makes the Debug Control window provide the most information. Then press F5 in the file editor window to run the program under the debugger.
The debugger starts at the import random line. Nothing special happens here, so just click Step to execute it. You should see the random module added to the bottom of the Debug Control window in the Globals area.
Click Step again to run line 2. A new file editor window will pop open showing the random.py file. Remember that the randint() function is inside the random module. When you stepped into the function, you stepped into the random module because that is where the randint function is. The functions that come with Python's modules almost never have bugs in their code, so you can just click Out to step out of therandint() function and back to your program. After you have stepped out, you can close the random module's window.
Line 3 is also a call to the randint() function. We don't need to step through this code, so just click Over to step over this function call. The randint() function's code is still executed, it is just executed all at once so that we don't have to step through it.
Line 4 is a print() call to show the player the random numbers. But since we are using the debugger, we know what numbers the program will print even before it prints them! Just look at the Globals area of the Debug Control window. You can see the number1 and number2 variables, and next to them are the integer values stored in those variables. When I ran the debugger, it looked like Figure 7-4.
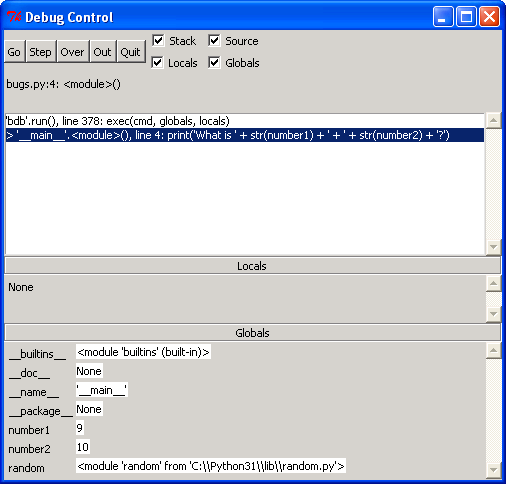
Figure 7-4: number1 is set to 9 and number2 is set to 10.
The number1 variable has the value 9 and the number2 variable has the value 10. When you click Step, the program will display the string in the print() call with these values. (Of course, we use the str()function so that we can concatenate the string version of these integers.)
Clicking on Step on line 5 will cause the debugger to wait until the player enters a response. Go ahead and type in the correct answer (in my case, 19) into the interactive shell window. The debugger will resume and move down to line 6.
Line 6 is an if statement. The condition is that the value in answer must match the sum of number1 and number2. If the condition is True, then the debugger will move to line 7. If the condition is False, the debugger will move to line 9. Click Step one more time to find out where it goes.
The debugger is now on line 9! What happened? The condition in the if statement must have been False. Take a look at the values for number1, number2, and answer. Notice that number1 andnumber2 are integers, so their sum would have also been an integer. But answer is a string. That means that the answer == number1 + number2 condition would have evaluated to '19' == 19. A string value and an integer value will always not equal each other, so the condition would have evaluated to False.
That is the bug in the program. The bug is that we use answer when we should be using int(answer). Go ahead and change line 6 to use int(answer) == number1 + number2 instead of answer == number1 + number2, and run the program again.
What is 2 + 3?
5
Correct!
5
Correct!
This time, the program worked correctly. Run it one more time and enter a wrong answer on purpose to make sure the program doesn't tell us we gave the correct answer. We have now debugged this program. Remember, the computer will run your programs exactly as you type them, even if what you type is not what you intend.
Break Points
Stepping through the code one line at a time might still be too slow. Often you will want the program to run at normal speed until it reaches a certain line. You can do this with break points. A break point is set on a line when you want the debugger to take control once execution reaches that line. So if you think there is a problem with your code on, say, line 17, just set a break point on line 17 (or maybe a few lines before that) and when execution reaches that line, the debugger will stop execution. Then you can step through a few lines to see what is happening. Then you can click Go to let the program execute until it reaches the end (or another break point).
To set a break point, right-click on the line that you want a break point on and select "Set Breakpoint" from the menu that appears. The line will be highlighted with yellow to indicate a break point is on that line. You can set break points on as many lines as you want. To remove the break point, click on the line and select "Clear Breakpoint" from the menu that appears.
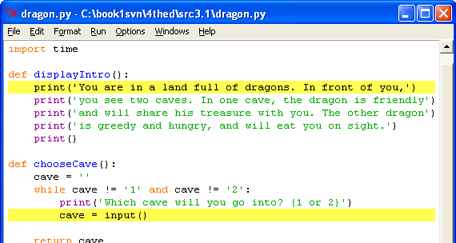
Figure 7-5: The file editor with two break points set.
Example of Using Break Points
Let's try debugging a program with break points. Here is a program that simulates coin flips by calling random.randint(0, 1). Each time this function call returns the integer 1, we will consider that "heads" and increment a variable called heads. We will also increment a variable called flips to keep track of how many times we do this "coin flip".
The program will do "coin flips" one thousand times. This would take a person over an hour to do, but the computer can do it in one second! Type in the following code into the file editor and save it as coinFlips.py. You can also download this code from http://inventwithpython.com/coinFlips.py
coinFlips.py
This code can be downloaded from http://inventwithpython.com/coinFlips.py
If you get errors after typing this code in, compare it to the book's code with the online diff tool at http://inventwithpython.com/diff or email the author at al@inventwithpython.com
This code can be downloaded from http://inventwithpython.com/coinFlips.py
If you get errors after typing this code in, compare it to the book's code with the online diff tool at http://inventwithpython.com/diff or email the author at al@inventwithpython.com
- import random
- print('I will flip a coin 1000 times. Guess how many times it will come up heads. (Press enter to begin)')
- input()
- flips = 0
- heads = 0
- while flips < 1000:
- if random.randint(0, 1) == 1:
- heads = heads + 1
- flips = flips + 1
- if flips == 900:
- print('900 flips and there have been ' + str(heads) + ' heads.')
- if flips == 100:
- print('At 100 tosses, heads has come up ' + str(heads) + ' times so far.')
- if flips == 500:
- print('Half way done, and heads has come up ' + str(heads) + ' times.')
- print()
- print('Out of 1000 coin tosses, heads came up ' + str(heads) + ' times!')
- print('Were you close?')
The program runs pretty fast. It probably spent more time waiting for the user to press the Enter key than it did doing the coin flips. Let's say we wanted to see it do coin flips one by one. On the interactive shell's window, click on Debug and then Debugger at the top menu to bring up the Debug Control window. Then press F5 to run the program.
The program starts in the debugger on line 1. Press Step three times in the Debug Control window to execute the first three lines (that is, lines 1, 2, and 3). You'll notice the buttons become disabled because theinput() function has been called and the interactive shell window is waiting for the player to type something. Click on the interactive shell window and press Enter. (Be sure to click beneath the text in the shell window, otherwise IDLE might not receive your keystrokes.) After entering text for the input() call, the Step buttons will become enabled again.
You can click Step a few more times, but you'll find that it would take quite a while to get through the entire program. Instead, set a break point on lines 12, 14, and 16 (Figure 7-6).
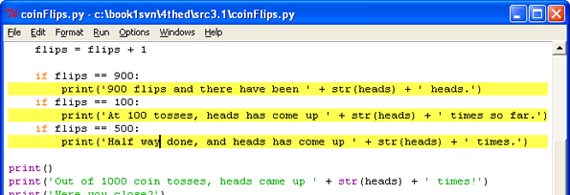
Figure 7-6: Three break points set.
After setting the breakpoints, click Go in the Debug Control window. The program will run at its normal speed until it reaches flip 100. On that flip, the condition for the if statement on line 13 is True. This causes line 14 (where we have a break point set) to execute, which tells the debugger to stop the program and take over. Look at the Debug Control window in the Globals section to see what the value of flips and heads are.
Click Go again and the program will continue until it reaches the next break point on line 16. Again, see how the values in flips and heads have changed. You can click Go one more time to continue the execution until it reaches the next break point.
And if you click Go again, the execution will continue until the next break point is reached, which is on line 12. You probably noticed that the print() functions on lines 12, 14 and 16 are called in a different order than they appear in the source code. That is because they are called in the order that their if statement's condition becomes True. Using the debugger can help make it clear why this is.
Summary
Writing programs is only part of the work for making games. The next part is making sure the code we wrote actually works. Debuggers let us step through the code one line at a time, while examining which lines execute (and in what order) and what values the variables contain. When this is too slow, we can set break points and click Go to let the program run normally until it reaches a break point.
Using the debugger is a great way to understand what exactly a program is doing. While this book provides explanations of all the games in it, the debugger can help you find out more on your own.


0 comments:
Post a Comment